- 分享到:
The pie charts contain information in percentage terms about the metal commodities produced by two countries.
Summarise the information by selecting and reporting the main features, and make comparisons where relevant.
Write at least 150 words.
文中词汇表达不够丰富,要多积累学术词汇;可适当增加从句的使用,注意文中的一些小错误;上下文衔接不流畅,文章结构不严谨;请注意分段。
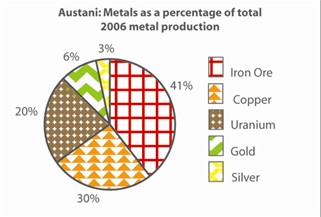
The pie charts show that the information about the percentage of 2006 metal production.Iron Ore is used as the main metal,which accounts for 41%,is the most popular.Copper,which accounts for 30%,is the second most popular,10% more than the third one-Uranium.It is 20% of the map.The last two are Gold and Silver,which account for 6% and 3%.They are less popular than the main three.
