- 分享到:
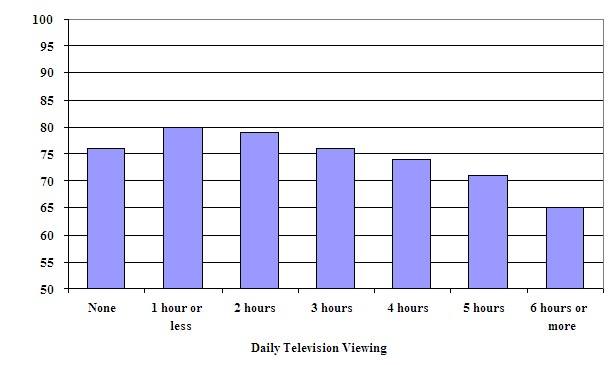
The bar chart below gives information about the average science test scores of Grade 8 students in relation to the number of hours they watch television each day. .
Summarise the information by selecting and reporting the main features, and make comparisons where relevant.
Write at least 150 words.
单词拼写做的不错,文中词汇表达贫乏;文中从句使用量偏少;连接词过少,建议增加衔接词汇的积累;请注意分段;连词使用偏少;请提高文章内敛性,段落和句子要围绕主题展开。
The graph shows us students from grade 8 spend time on television viewing everyday.Most of them spent 1 hour or less.There are 80 people of the amount number of 520.And it hit to the peak of this graph.About 76 students spent none on television.The number of students have a downing tend,while they spent more on television. In a word,
