- 分享到:
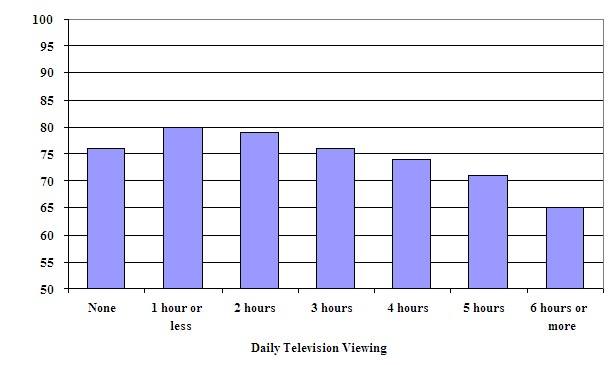
The bar chart below gives information about the average science test scores of Grade 8 students in relation to the number of hours they watch television each day. .
Summarise the information by selecting and reporting the main features, and make comparisons where relevant.
Write at least 150 words.
拼写做的很棒,在平时练习中注意词汇量的积累;可适当增加从句的使用;行文稍显不流畅,应增加文中衔接词的使用。
The diagram shows the statistics about how the academic scores of the Grade 8 students correlated with their daily television viewing time. In general, the longer time students spent on watching TV, the lower scores they got in the test. As can be seen from the bar chart, it's interesting to notice that students who didn't watch TV at all could not get marks as high as the students setting aside an our to watch, as the former only scored about 76 while the latter hit 80. When it comes to the other students, it seems more reasonable. Student's scores are decreasing as their daily television viewing time is rising. Students who watched for the least period of time get the highest score at 80, and their peers who get the lowest score of 645 watched even more than 6 hours a day! With the evidence, we could easily come to the conclusion that television watching time is indeed related to student's academic performance. Thus, it will be a sensible way to limit students' TV watching time.
