- 分享到:
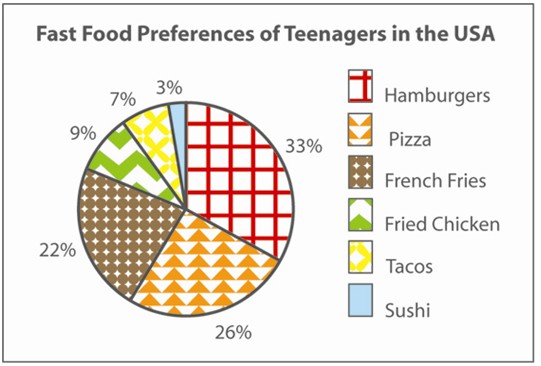
The pie chart below gives information about the fast food preferences of teenagers in the USA.
Summarise the information by selecting and reporting the main features, and make comparisons where relevant.
Write at least 150 words.
作者句法知识很棒,适当增加从句的使用,会取得更不错的成绩;文章层次较为清晰;作者能较灵活地使用词汇,学术词汇使用较恰当,但存在一些拼写错误;请注意分段;请提高文章内敛性,段落和句子要围绕主题展开。
The pie chart show data about the teenagers eat fast food preference in the USA. As we can see from the pie chart that at nowdays ,the remarkable improvement people's living standard.Many teenagers like eat the fast food among the Hamburgers is popular best that great occupy 33percent.The second popular food is Pizza that make up 26percent.Following the French Fries represent 22percent .The last the Sushi just onli account for 3percent the Fried Chicken are time as high as the Sushi and Tacos make up 7percent.
