- 分享到:
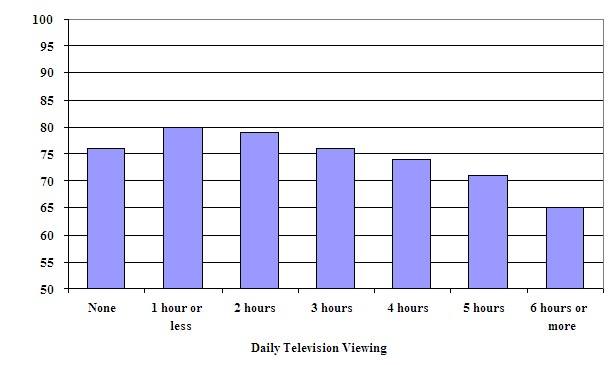
The bar chart below gives information about the average science test scores of Grade 8 students in relation to the number of hours they watch television each day. .
Summarise the information by selecting and reporting the main features, and make comparisons where relevant.
Write at least 150 words.
采用了简单的衔接手法,行文流畅;文中有几处句子错误;能较灵活地使用部分学术词汇,有基础拼写错误,需要注意一下。
A glance at the figure provided reveals the significant relationship between average science test scores and the number of television watching hours of Grade 8 students. It is evident that students contribute less hours for watching television enjoys higher test scores.With average 80 scores,student who watch only 1 hour or less got far more than 15 scores than those actually spend 6 hours or more on television,at the level merely higher than pass.Among the students who share times for television more or less everyday,there are average 5 scores corresponding to 2 hours watching and the decrease represent gradually and steadily. Also noteworthy is the fact that,although test a relatively high scores,students endow all their times on study without any leisure times may not implay the most efficient choice,just equal with the students`result who make 3 watching hours and less for 4 scores than those with 1 watching hour and 3 than those with 2 hours.
