- 分享到:
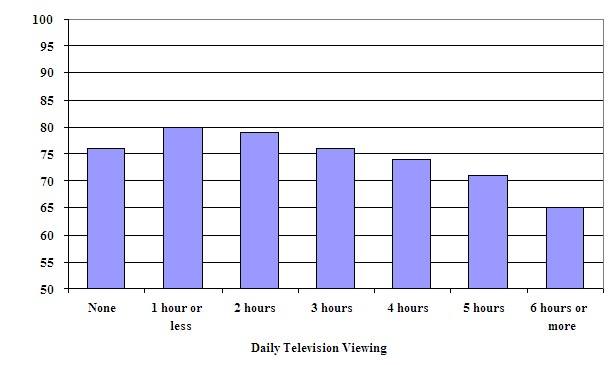
The bar chart below gives information about the average science test scores of Grade 8 students in relation to the number of hours they watch television each day. .
Summarise the information by selecting and reporting the main features, and make comparisons where relevant.
Write at least 150 words.
文章用词太过单一,请注意变换表达方式;错误句子很少,但从句使用不熟练;文章结构不够严谨,应增加过程性词汇的使用。
The graph illustrates that information about the average science test scores of Grade 8 students in relation to the number of hours,zero hero,one hour or less,two hours,three hours,4hours,five hours,six hours or more respective. They watch television every day. Most of Grade 8 students watch television one hour or less in each day. appromixate the number of 79 students watch TV two hours,the student number of not watch TV is similar with the number of students watch TV three hours each day. Next is four hours,about 74 Grade 8 students.and the five hours each day is about 71 student.Less Grade eight student will watch TV for six hours or more. In conclusion,the best time to spend in watch TV is one hour or less.
