- 分享到:
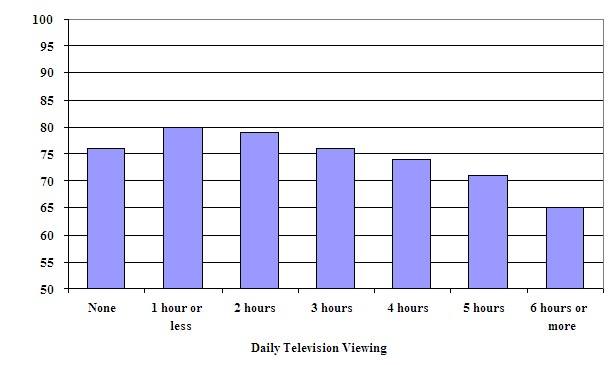
The bar chart below gives information about the average science test scores of Grade 8 students in relation to the number of hours they watch television each day. .
Summarise the information by selecting and reporting the main features, and make comparisons where relevant.
Write at least 150 words.
语句间的衔接成分用的不错,同时文章中的过程性词汇很丰富;文中有几处句子错误;作者学术词汇使用比较准确,词汇表达较丰富,但仍需增加词汇积累。
The bar chart demonstrates the average time that a group of grade 8 students spent on watching television every day. It can be seen from the graph that the students who watch TV one hour or less are exactly 80, which occupies more than one-sixth of objects(about 521 students) and the pupils watching TV 2hours each day is slightly less than the former one, followed by students watching 3 hours and it is interesting to observe that the number of students who do not watch TV nowadays equal to that(approximately 76 students). From then on, there is a decrease tendency can be seen with the increase of watching time, which looks like a staircase. finally, the individuals who watch TV 6 hours every one, who must be a big TV fans, I suppose, and also the maximum watching in this survey is 60 peoples. To sum up, a vast majority of students are tend to watch 0-3 hours TV as a entertainment to kill time.
