- 分享到:
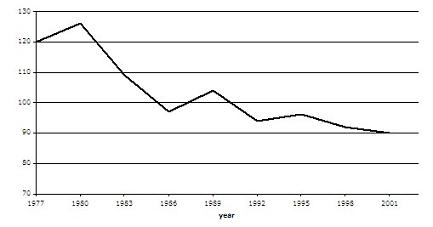
The graph contains information about the population of birds in Europe over a period of twenty four years.
Summarise the information by selecting and reporting the main features, and make comparisons where relevant.
Write at least 150 words.
文章学术词汇使用熟练,但请作者增加词汇丰富度;文中衔接词丰富;错误句子很少,但从句使用不熟练;请提高文章内敛性,段落和句子要围绕主题展开。
The line graph illustrates the trend about the population of birds in Europe in twenty years . It is very clear the number of birds is fluctuating but mainly showing the downward trend. At 1977, the birds population stands at 120 and in the next three years,the number goes up, peaking at about 126. And then, there is a sharply decreasing until to 1986 with the number of 98. Next three years, the line raises up again to the 113, and then decline gradually over the last 10 years. In 2001, the number of birds' population is located at 90. The line graph show clearly the downward trend of birds population in 20 years.
