- 分享到:
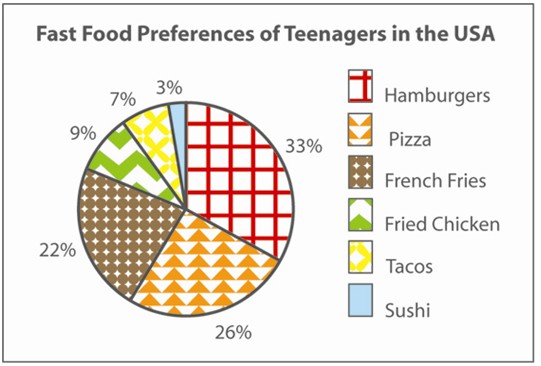
The pie chart below gives information about the fast food preferences of teenagers in the USA.
Summarise the information by selecting and reporting the main features, and make comparisons where relevant.
Write at least 150 words.
作者学术词汇使用比较准确,不过文中词汇表达贫乏;作者有一定功底,可在平时练习中增加长难句的记忆;不能熟练使用过渡词,文章结构欠佳;连词使用偏少。
the bar chart shows the amount of fast food consumed by teenager in the USA. As it illustrates the hamburgers was the main source of teenager consumption in fast food,with 33%. followed by pizza and french fries, with 26% and 22% receptively. after that, the fried chicken and tacos take the similar place in the diagram which are 9% and 7%.in contrary, sushi as a health food which take the lowest place in the bar chart,with only 3%. overall, the hamburgers take the largest place in the fast food industry, teenagers spent a lot of money in it.
