- 分享到:
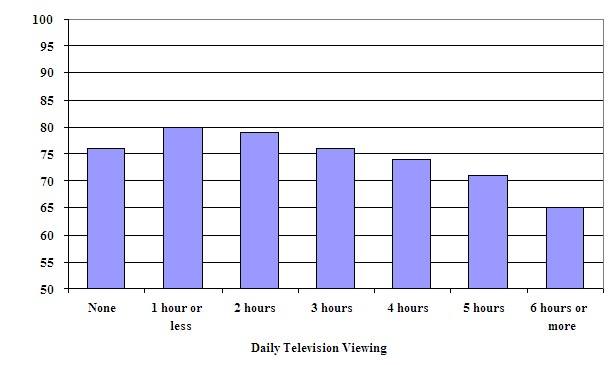
The bar chart below gives information about the average science test scores of Grade 8 students in relation to the number of hours they watch television each day. .
Summarise the information by selecting and reporting the main features, and make comparisons where relevant.
Write at least 150 words.
采用了恰当的衔接手法,层次清晰;很好的运用了从句,但部分句子稍有瑕疵;文中用词稍显贫乏。
The diagram illustrates the number of changes in the grade of science test of 8 students who spend 6 hours or more, 5hours, 4hours, 3hours, 2hours, 1hours or less and 0hours on watching TV everyday. From the table it can easy to see that the grade of student who watched TV 1hour or less which was 80 score, ranks the first; then next is that of 2hours with about 78 scour; followed by that of 3hours, constituting 75 score, which has little different from that of never watched TV. Compared with that, the grade of that of 4hours, 5hours and 6hours or more was 74 score, 71 score and 65 score respectively. In conclusion, taking 1hour or less to have a break to watch tv is the best way to get the higher score in test than others.However, spending 6hours or more is bad for achieving the better score. In other words, it has negative influence on study for student.
