- 分享到:
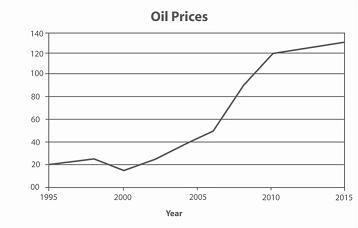
The graph contains information about the price in US dollars of a barrel of oil from 1995 with predictions to 2015.
Summarise the information by selecting and reporting the main features, and make comparisons where relevant.
Write at least 150 words.
文章词汇表达丰富,学术词汇积累做的也很棒;句式灵活多变,再加强从句的使用会更棒;恰当的使用了过渡词和衔接词,衔接手法做的很棒。
As the national economy runs into the high inflation,USA have been seeing a incline of the oil price in US dollars and this trend seems to last for a period of time until the financial authority changes the policies they are executing now. As we can see,the oil price in 1995 was 20 dollars while it would get up to 130 dollars approximately next year with prediction of some exceptional experts,though the increasing rate has been slow in recent years. In the meantime,we can figure out three main parts in the graph.From 1995 to 2000,the price did not change virtually,and it even drop down at the end of 1990s.It reflects the excellent progress in enlarging the happiness of the people Pro-President Clinton has achieved.Whereas,the oil prices faced a rapid incline throughout the next ten years because of the anti-extremist war took place in 2001 due to the 911 event in which jihadists destroyed the landmark of the USA by two airplanes.And in the recent decade,the price decreases its increasing rate under the influence of the financial crisis in 2008.
