- 分享到:
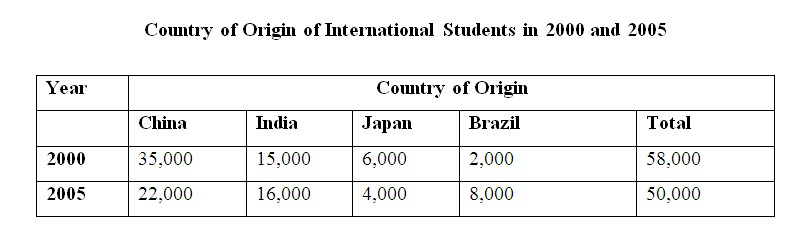
The table below gives information about the numbers of international students from four areas of the world who came to study at university level in a western country in 2000 and 2005.
Summarise the information by selecting and reporting the main features, and make comparisons where relevant.
Write at least 150 words.
文章学术词汇使用熟练,但请作者增加词汇丰富度;复杂句使用不错,句法规范;全文结构较为严谨;请注意分段。
The table illustrates the number of students from four different countries who attended tertiary institutions in a western country in 2000 and 2005. Overall, the number of international students dropped slightly over this five year period, and in particular there was a significant decrease in numbers from China, although it still remained the largest group. There was a four fold rise in Brazilian student enrolments. In 2000, the number of students who came from China, at 35,000, was more than twice the number of Indian students, at 15,000. Smaller numbers came from Japan and Brazil, at 6,000 and 2,000 respectively. In 2005, the proportion of students changed considerably. Chinese student numbers decreased to 22,000, but there was a dramatic increase in the number of Brazilian students, which went from 2,000 to 8,000. Indian student numbers stayed mostly unchanged, at 16,000 and there was a small decrease in the number of Japanese students, from 6,000 in 2000 to 4,000 in 2005.
