- 分享到:
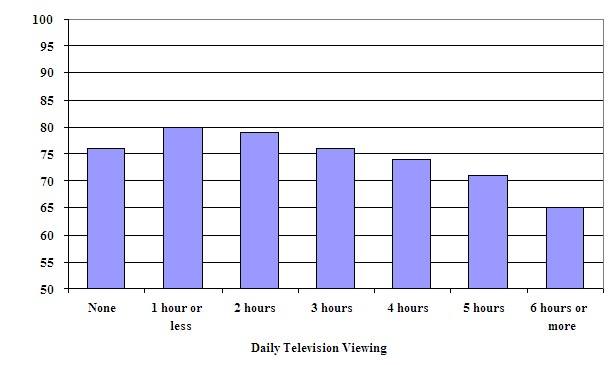
The bar chart below gives information about the average science test scores of Grade 8 students in relation to the number of hours they watch television each day. .
Summarise the information by selecting and reporting the main features, and make comparisons where relevant.
Write at least 150 words.
采用了适当的衔接手法,层次清晰;可增加从句和复杂句的使用;作者学术词汇积累做的很棒,但总体词汇量偏小;请注意分段。
As the table represented that the greatest proportion of the amount of Grade 8 students is spending 1 hour or less each day,with the percentage of 80.After that,there has been allocated under 80 percent accounting for 2 hours a day to watch TV,but over the 75 percent considerablely.Compared with the Grade 8 student spending 3 hours in watching TV,over 75 percent and 76 percent approximately,of the Grade 8 student without watching TV in their daily life showed the same proportion. While,there has been generated a move that the proportion represented slower with the longer of the television time.The specific data was:under 75 percent and nearly 74 percent was found in the 4 hours spended in TV,and over 70 percent but nearly 70 percent was collected in the 5hours watching TV,finally,the percentage of 6 hours spended on watching TV about 60 percent was comparatively small.
