- 分享到:
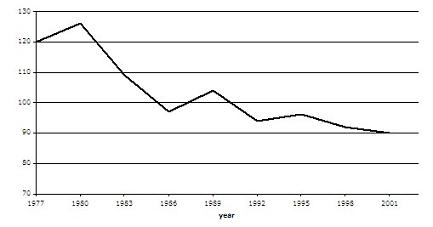
The graph contains information about the population of birds in Europe over a period of twenty four years.
Summarise the information by selecting and reporting the main features, and make comparisons where relevant.
Write at least 150 words.
单词拼写做的不错,文中词汇表达贫乏;句式变化较为丰富;上下文衔接不流畅,文章结构不严谨;请注意分段;可以适当增加副词的使用;连词使用偏少。
The graph shows that the population of birds in Europe is declined.the numbers of the birds up to 125millions by 1980 but it went down fast to less than 100milions by 1986,and it reached to 105million and then down to 95million.by the end of 2001 the number went down to 90 millions and the line will remain go down.
