- 分享到:
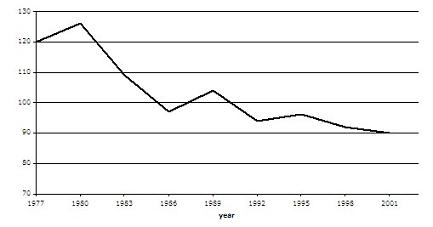
The graph contains information about the population of birds in Europe over a period of twenty four years.
Summarise the information by selecting and reporting the main features, and make comparisons where relevant.
Write at least 150 words.
行文较为流畅,作者文中过渡词使用的不错;若增加一些从句的使用,文章会更不错;文章中拼写错误较多,同时请作者增加词汇丰富度;请注意分段;请提高文章内敛性,段落和句子要围绕主题展开。
The graph shows that the population of birds in Europe is declined.from 1977 to 1980 three year's intervials the numbers of the birds is up to 125millions but it went down quickly durning 1980 to 1986. the number of the birds is less than 100 milion by 1986.Durning the next three years it slowly went up to 105 million and then sharply down to 95million.from 1992 to 1995 the number of the birds grows hardly and then went down to 90 millions and the line will remain go down.
