- 分享到:
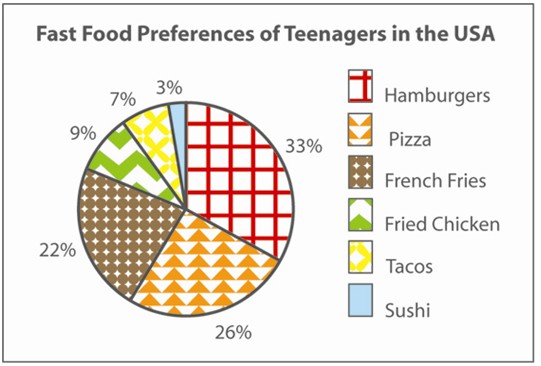
The pie chart below gives information about the fast food preferences of teenagers in the USA.
Summarise the information by selecting and reporting the main features, and make comparisons where relevant.
Write at least 150 words.
从句数量偏少,且文中有几处句子错误;文中词汇表达贫乏,词汇拼写也不够认真;语言不流畅;连词使用偏少;请提高文章内敛性,段落和句子要围绕主题展开。
The pie chart below shows datas about the fast food precentage of teenagers in the USA. it can be seen from this pie chart that the hanburgers are ccounts of the largest percentage(33%).Specifically the tacos are simiar to the hamburgers ,it is makes up 26 percentage in this pie chart .Next the French Fries is the third largest in the USA fast food ,it is account of 22 preferences in the chat . According to the second pie chart ,it clearly shoes that heating and air conditiongin While others are not very popular in the USA .They are all togerther in this chart is making up 19 precentage in this pie chart Overall,from this pie chat we can know the hanburgers are the popular fast food in the USA.The USA goverment maybe can should more fast food restaurant do more hamburger for the person in the USA.But remenber it most of the fast food is not very heathly.
