- 分享到:
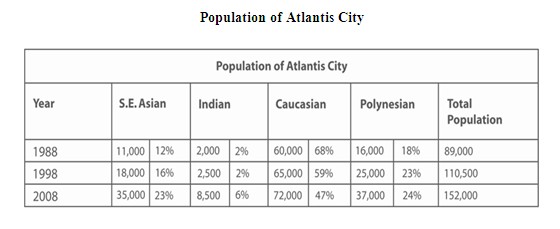
The table contains information about the different ethnic groups making up the population of Atlantis City over two decades. Summarise the information by selecting and reporting the main features, and make comparisons where relevant. Write at least 150 words.
文章衔接手法恰当;可将文中的简单句转换为长句或者复杂句;作者词汇使用较为丰富熟练,单词拼写方面要更仔细。
The first graph shows that global water use by sectors was continue rising the datas in the past 100 years.The water of agriculture use is much more than industrial and domestic use.In 1900,there was only 500 m3 water used by agriculture.Nonetheless,there were 6 times than before which is 3000 m3 water use in 2000.How about the water of industrial and domestic use?The graph shows that also is a rising line with them. Let's get some information through the another graph .It shows the water consumption between two different countries in 2000.One is Brail which has 176 million people in a 26500 km2 irrlated land.The avarage of water consumption is 359m3.And the other one is Congo which has 5.2 million people of the population.The water consumption per person is only 8m3 in the land of 100 km2.So poor the guys are. We can gress form that the water was over-use in some countries due to other countries like Congo which has a poor water resourses to use.
