- 分享到:
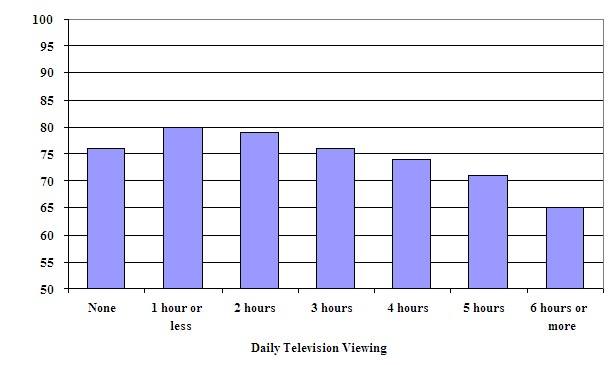
The bar chart below gives information about the average science test scores of Grade 8 students in relation to the number of hours they watch television each day. .
Summarise the information by selecting and reporting the main features, and make comparisons where relevant.
Write at least 150 words.
作者学术词汇使用比较准确,词汇表达较丰富,但仍需增加词汇积累;作者句法知识掌握的错误,可适当增加从句的使用;全文结构较为严谨。
this bar chart demonstrates the relationship between daily time spent on watching TV by grade 8 students and their average scores in scientific tests. To our surprise, it is not a constant negative correlation. From this chart, we can find that pupils who spend 1 hour or less on watching tv achieve the highest score, averaging at 80. With the time spent on watching tv increases, students' performances in scientific test decline gradually. While an two-hour-TV-watching leads to a slight decrease in score to 79, another extra hour results a more noticeable drop to 76, which is the same score as non-TV-watching students have. The most remarkable decline is found between students who spend 5 hours and 6 hours or more on tv watching, decreasing from 71 to 65, which is also the least score among all groups. Overall, moderate tv-watching can maximize students academic performance while both excessive viewing or none viewing of TV has a negative impact on their study.
