- 分享到:
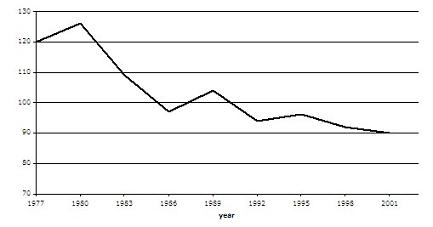
The graph contains information about the population of birds in Europe over a period of twenty four years.
Summarise the information by selecting and reporting the main features, and make comparisons where relevant.
Write at least 150 words.
采用了简单的衔接手法,行文流畅;可适当增加几条从句;作者词汇量比较丰富,一些高级词汇的使用也比较灵活,但要避免出现拼写错误。
From the graph,we are provided with data from 1977 to 2001, concerning the population of birds in Europe. As we can see in the graph,the total population had decreased untill 2001,which is from 120 to 90,nearly decreased 25 percent during this period.Looking closely,the maxmum of the population had happened in 1980,but after that,it began to go down ,lasting 5 years behind.Untill 1985,the population bagan to rise and the it had a dip in 1990.What is more,after the tiny growing from 1992 to 1995,the population started to decline and the numbers descend to 60 in 2001. In conlusion,the population of birds have a fluctuation during this period but it become stabilization after 1995.
人气:108发布:2017-03-22
人气:82发布:2014-08-20
人气:66发布:2015-11-21
