- 分享到:
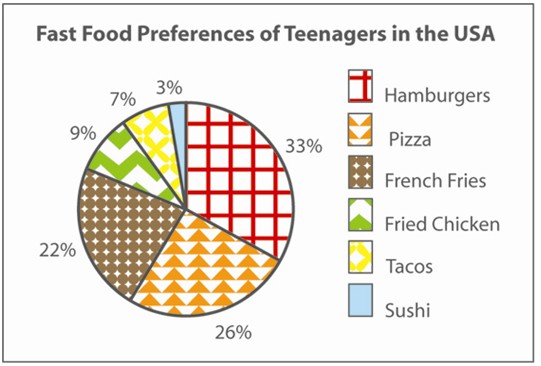
The pie chart below gives information about the fast food preferences of teenagers in the USA.
Summarise the information by selecting and reporting the main features, and make comparisons where relevant.
Write at least 150 words.
语句间的衔接成分用的不错,同时文章中的过程性词汇很丰富;文章高级词汇使用熟练,词汇表达较为丰富;可适当增加几条从句。
the pie chart illustrates teenagers' preferences on fast food, especially on hamburgers, pizza, french fries, fried chicken, tacos and sushi in America. According to the chart, it is hamburgers that stand in an obvious status as the only one with the ratio of one third. Followed by pizza and french fries, the proportion is 26% and 22% respectively. What also deserves attentions is that the total percentage of the last three preference fast food still can not surpass what hamburgers occupies, which again emphasize the popularity of hamburgers in America among teenagers. While among the last three, it is sushi that takes the least proportion, say 3%, followed by tacos which holds 7%. Fried chicken possesses 9% of the ratio, ranking as the fourth favourite in fast food. In all, hamburgers, as the most popular fast food, grasp more than 10 times preference than sushi.
