- 分享到:
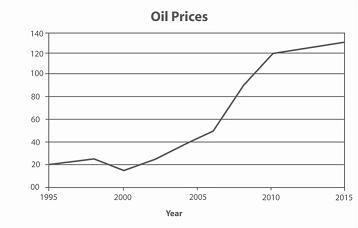
The graph contains information about the price in US dollars of a barrel of oil from 1995 with predictions to 2015.
Summarise the information by selecting and reporting the main features, and make comparisons where relevant.
Write at least 150 words.
语句间的衔接成分用得不错,同时文章中的过程性词汇很丰富;作者句法知识扎实,但从句稍微偏少;拼写方面做得很棒,平时练习中注意词汇量的积累。
The line graph shows the increasing trend of oil price which is from 20 dollars in 1995 to over 120 dollars in 2015. And we can see there are four stages in oil price changes clearly. The first stage is from 1995 to 2000, in which the price of a barrel of oil is fluctuate around 20 dollars. Then in the first five years in 21st century the oil price rose by one time to 40 dollars. After 2005, the third stage ending in 2010 saw a dramatic increase in oil price which is as much 6 times as that in 1990. But after 2010, the rate of increasing is expected to slump and until 2015 the expected value of oil price would be approximately 130 dollars per barrel.
