- 分享到:
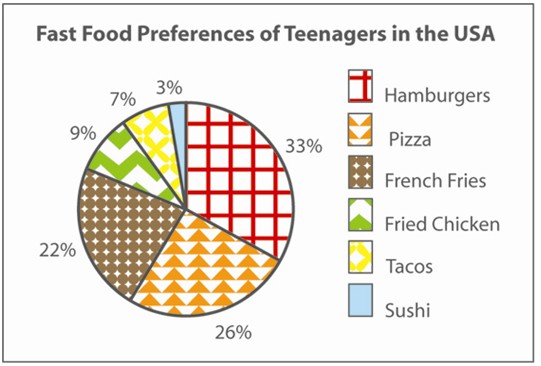
The pie chart below gives information about the fast food preferences of teenagers in the USA.
Summarise the information by selecting and reporting the main features, and make comparisons where relevant.
Write at least 150 words.
文中过渡词和衔接词使用较少;作者句法基本功不错,可适当增加从句的使用;作者能较灵活地使用词汇表达,但高级词汇的积累还有很大的空间。
The pie chart shows that the fast food preferences of teenagers in the USA, including hamburgers, pizzas, French fries, fried chicken, tacos, sushi. We can see in the pie chart is that hamburgers account for the largest proportion in the pie chart, at 33%. Pizza makes up 26 percent in the pie chart. French fries is also teenagers' favorite in the USA, which occupies 22 percent of all in the chart. Only 7% and 9% teenagers prefer tacos and fried chicken respectively in the USA. The smallest proportion of the chart is sushi. According to the chart, we can see that the most favored three fast foods take up over three-quarter of the chart, becoming the main fast food of teenagers in the USA. However, the rest part in the chart, adding up to only 19 percent, is less than the third most popular one. In a word, teenagers in the USA prefer the three most popular fast food are hamburgers, pizzas and French fries.
