- 分享到:
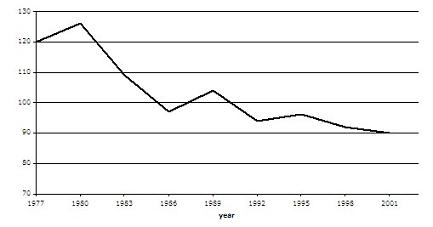
The graph contains information about the population of birds in Europe over a period of twenty four years.
Summarise the information by selecting and reporting the main features, and make comparisons where relevant.
Write at least 150 words.
文章高级词汇使用熟练,词汇表达较为丰富;句式变化多样,句法方面做的很棒;建议增加衔接词和过渡词的使用。
The line graph shows the population of birds in Europe over a period of 24 years. At the beginning of 1977, the number of birds in Europe was about 120. Afterwards, it slightly increased and reached a peak level of more or less 125 in the year of 1980. However, the number of birds in Europe rapidly declined to around 98 from 1980 to 1985. It minutely went up to roughly 105 between 1985 to 1989. However, it began to come down during the period from 1992 to 2001. The year of 2001 was the year in which the number of birds was lowest and more lower than the start line of the beginning of 1977. Owing to the protection measures of birds were taken, the number of birds in Europe went up frome 1977 to 1980 and the period from 1985 to 1989. Nevertheless, the climate change and global warming dramatically affected the environment. Thus, the population of birds in Europe declined as a whole over the 24 years. That was the whole mode of the population of birds in Europe over 24 years.
