- 分享到:
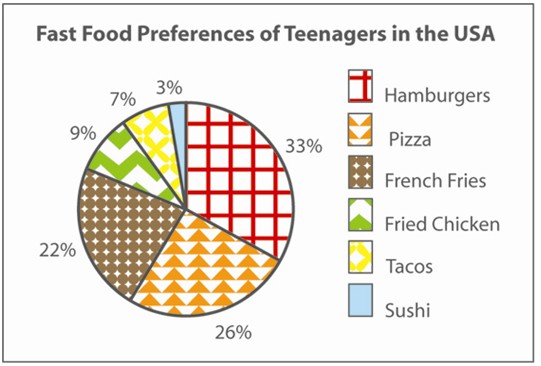
The pie chart below gives information about the fast food preferences of teenagers in the USA.
Summarise the information by selecting and reporting the main features, and make comparisons where relevant.
Write at least 150 words.
行文稍欠流畅,应适当增加连接词的使用;适当增加一些从句的使用,会为文章添彩;文中能较熟练地使用一定的学术词汇,但词汇表达多样性不高,拼写检查还需加强;请提高文章内敛性,段落和句子要围绕主题展开。
The pie graph shows us that the percentation about teenagers whose are usually eat fast food in America. With the development of rapid-life in America, more and more teenagers like to eat fast food rather than main food. From the chart, we can clearly see that hamburrgers, pizza and fresh fries take up the largest percent in all fast food and up to 81%. Hamburgers is the number one that take up more than queater with 33%. The next diagram is pizza, it account for 26%. Finally, it is french fries, it only less 4% than pizza. As fas as I know that the last three fast food only take up one fourth. The lowest prepertation is sushi, it account for the 3% in the 100%. Then the tacos is the last number two, there is 7% teenagers like to eat tacos. The biggest percentation of those three fast food is fried chicken, it take up 9%. That shows us there are 9% students like to eat it. Above all, we can know that the teenagers in America like to eat fast food, especially hambueegers, pizza and fresh fries. The fast food is convenient for them, such as they go to school or have a picnic, the fast food can take out and eat with walking. Hence teengers like that.
