- 分享到:
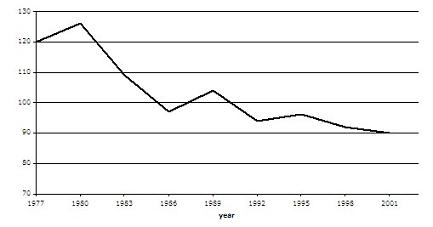
The graph contains information about the population of birds in Europe over a period of twenty four years.
Summarise the information by selecting and reporting the main features, and make comparisons where relevant.
Write at least 150 words.
作者学术词汇使用比较准确,不过文中词汇表达贫乏;文章结构严谨,有效地使用了语句间的衔接成分;可适当增加从句和复杂句的使用;请注意分段。
This plot demonstrates the fluctuation of the population of birds in Europe from 1977 to 2001. The total number of birds generally decreased in the twenty four years whereas it bounced three times from 1977 to 1990, 1988 to 1989 and 992 to 1995 separately.In 1997, there were 120 birds in total then there was a slightly increase but in 1980, the total number of birds was no more than 130. Afterwards, a dramatic drop followed and the number of birds decreased to less than 100 in 1985.Fortunately, it increased again in 1989 but in 1992 it went down to around 95 .then it fluctuated between 90 and 100 an finally, in 2001 the total number of birds was 90.
