- 分享到:
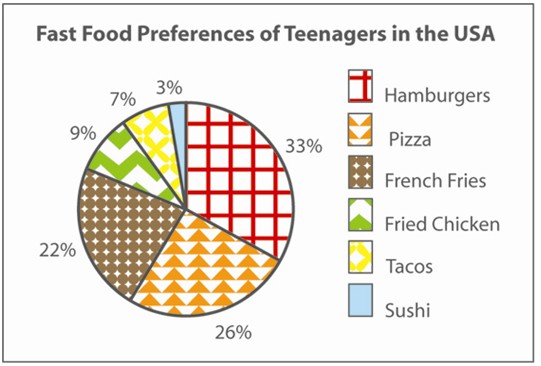
The pie chart below gives information about the fast food preferences of teenagers in the USA.
Summarise the information by selecting and reporting the main features, and make comparisons where relevant.
Write at least 150 words.
采用了恰当的衔接手法,层次清晰;句式变化多样;作者学术词汇使用比较准确,词汇表达较丰富,但仍需增加词汇积累;请提高文章内敛性,段落和句子要围绕主题展开。
The pie chart gives information about the fast food preferences among the adolescents in the U.S.A. It is clearly depicted in the pie chart that hamburgers are the most popular category of fast food among the American teenagers, representing 33% of all six kinds of fast food in the chart. Accounting for 26% of the total consumption, pizza comes second to hamburgers with regard to its popularity, preferred over French fries which contribute to 22% of the teenagers' fast food market in the U.S. Together the three most preferred fast food listed constitute 81% of the entire market. Consequently, there being a majority of adolescents prefer hamburgers, pizza and French fries, fried chicken and tacos follow the three with the figure for them 9% and 7% respectively, which are relatively small proportions. Sushi, however, as a typical and renowned Japanese food, ranks at the bottom of the pile in terms of popularity and consumption, with only substantially rare 4% of the adolescents surveyed in the USA making sushi as their choice for fast food. To epitomise the overall situation, traditional western fast food still plays a dominant role in the American teenagers' menu, regardless of whether it is junk food or not, which seems to result in the obesity, while still less teenagers tend to transforming their eating habit to a healthier one, making tacos and sushi their primary choice for fast food.
