- 分享到:
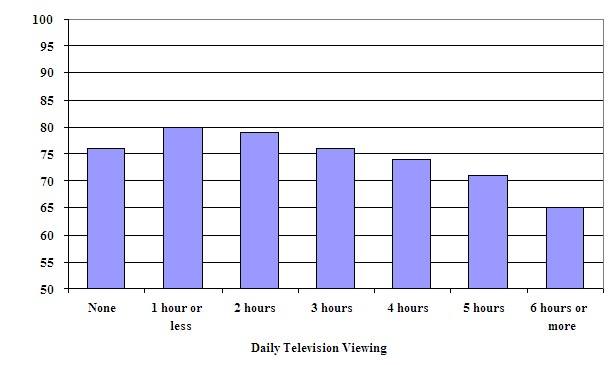
The bar chart below gives information about the average science test scores of Grade 8 students in relation to the number of hours they watch television each day. .
Summarise the information by selecting and reporting the main features, and make comparisons where relevant.
Write at least 150 words.

文中词汇表达不够丰富,要多积累学术词汇;可适当增加从句和复杂句使用;建议增加衔接词和过渡词的使用;请注意分段;连词使用偏少。
The bar graph shows the average science test scores of students in Grade 8 in relation to the hours they spend watching television. Overall, the students who watch less television have higher scores, and the average test score decreases as the number of viewing hours increases. The highest score of 80 is for students who usually watch one hour or less of television a day. The next highest score is approximately 79. This is for students who average two hours of television viewing. Students who watch no television and students who watch about 3 hours of television per day have a score of about 76. The lowest score of approximately 65 is for students who view six or more hours of television daily.