雅思TASK1小作文模拟题:媒体 Media
- 要求:
-
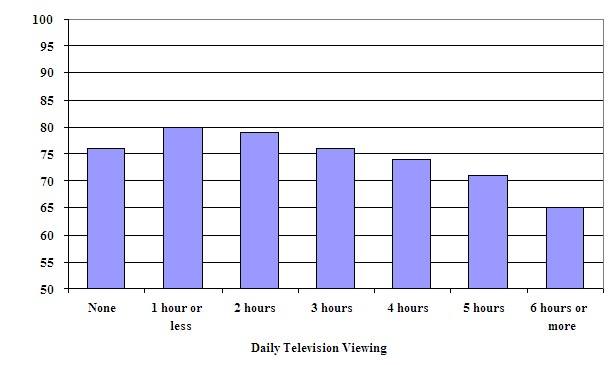
The bar chart below gives information about the average science test scores of Grade 8 students in relation to the number of hours they watch television each day. .
Summarise the information by selecting and reporting the main features, and make comparisons where relevant.
Write at least 150 words.

The bar graph shows the average science test scores of students in Grade 8 in relation to the hours they spend watching television. Overall, the students who watch less television have higher scores, and the average test score decreases as the number of viewing hours increases. The highest score of 80 is for students who usually watch one hour or less of television a day. The next highest score is approximately 79. This is for students who average two hours of television viewing. Students who watch no television and students who watch about 3 hours of television per day have a score of about 76. The lowest score of approximately 65 is for students who view six or more hours of television daily.
- 前一篇:雅思TASK1小作文模拟题:快餐 Fast food
- 后一篇:雅思TASK1小作文模拟题:教育 Education
- 相关推荐
- 会员评论(个评论)
-
登录|注册
