- 分享到:
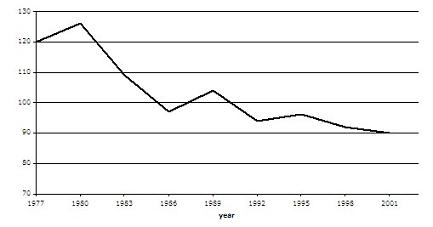
The graph contains information about the population of birds in Europe over a period of twenty four years.
Summarise the information by selecting and reporting the main features, and make comparisons where relevant.
Write at least 150 words.
语句间的衔接成分用的不错,同时文章中的过程性词汇很丰富;可增加文中从句的使用量;作者学术词汇使用比较准确,词汇表达较丰富,但仍需增加词汇积累。
A glance at the figure provided reveals the fluctuation of total amount of the jays in Europe from 1977 to 2001. It is disputable from the informations that since 1980s`, the population of birds saw a dramatically descend within this period.Before a three years`escalation,the population of European birds met an incredible draw-done from approximately 125 in 1980 to 97 in 1989,in vicinity of a decade,and plunged to a low point never before.This was followed by a transient recovery for merely 3 years after which the number experienced another two periods of decline again from 1989 to 1992 and 1995 to 2001 and then reach its nadir in 2001 at 90,an alleviation with slight extent can be seen in this process during 1992 and 1995. Also noteworthy is the fact that despite the increases within this twenty four years,the tendency was still dropping and endlessly broke the extreme line over and over.
人气:106发布:2017-03-22
人气:80发布:2014-08-20
人气:65发布:2015-11-21
