- 分享到:
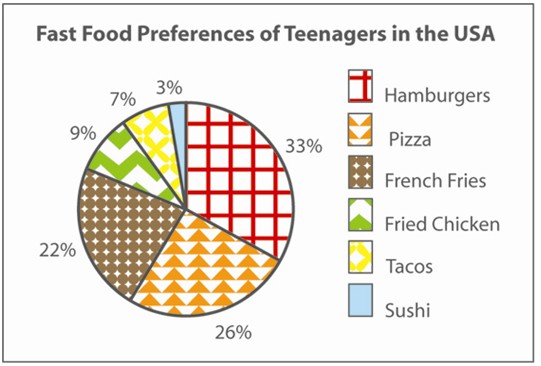
The pie chart below gives information about the fast food preferences of teenagers in the USA.
Summarise the information by selecting and reporting the main features, and make comparisons where relevant.
Write at least 150 words.
文章用词太过单一,请注意变换表达方式;文中衔接词丰富;若增加一些从句的使用,文章会取得更好的成绩;请注意分段;请提高文章内敛性,段落和句子要围绕主题展开。
The chart reflects the information about the fast food preferences of teenagers in the USA. The most of teenagers in USA ,as many as 33%, like the hamburgers very much , and the next fast food is pizza ,that was 26 percent . Of course , the top three must have french fries it is 22%. The next three fast food ,even mix there percent toughter is smaller than one proportion of that top three .The fried chicken is 9% ,and the Tacos is 7% ,the Sushi is only 3%.In conclusion ,the teenagers in USA very like the junk food , however that was unhealthy for their.
