- 分享到:
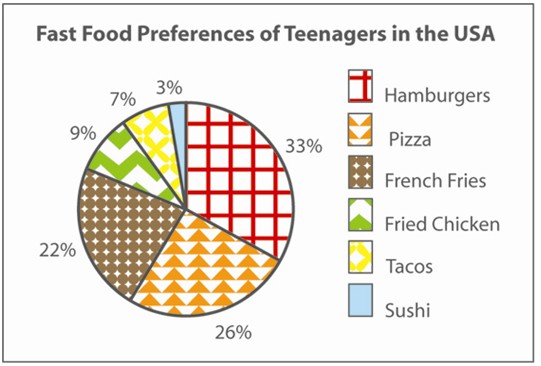
The pie chart below gives information about the fast food preferences of teenagers in the USA.
Summarise the information by selecting and reporting the main features, and make comparisons where relevant.
Write at least 150 words.
能较准确地使用学术词汇,还需请作者增加词汇丰富度;采用了适当的衔接手法,层次清晰;从句使用稍显不足,注意个别句子错误。
The diagram illustrates the proportion of fast food, which are hamburgers, pizza, french fries, fried chicken , tacos and sushi are ate by the youth in the usa. From the chart, it can be easy to see that the percentage of hamburgers was 33%, which ranks the first; The next was that of pizza, constituting 26%; Followed by that of french fries, was 22%. Compared with that, the proportion of fried chicken was little different from that of tacos, the former was 9% and the later was 7%. In addition, the percentage of Sushi occupied the smallest part, just over 3%. In conclusion, Hamburgers took up the largest part, which was the most popular fast food for the youth of America. The second largest part was pizza.
