- 分享到:
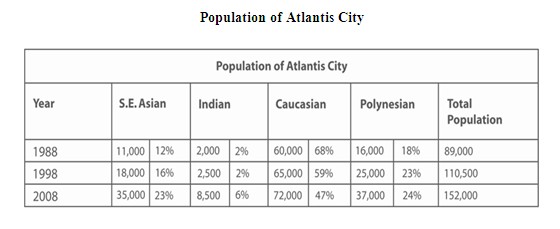
The table contains information about the different ethnic groups making up the population of Atlantis City over two decades. Summarise the information by selecting and reporting the main features, and make comparisons where relevant. Write at least 150 words.
学术词汇积累做的很棒,但总体词汇量稍小;复杂句使用不错,句法规范;全文结构较为严谨。
this table show the demographic change in the ethnic composition of Atlantic residents from 1988 to 2008. In 1988, Caucasians constituted the majority of the total population, making up 68% of a total population of 89000. The proportion of Caucasians declined gradually, falling to 59% in 1998 and 47% in 2008, although the absolute number of people increased steadily over the period, rising from 60000 to 72000 by 2008. However, they were still the largest ethnic group by the end of the period. In contrast, the other three ethnic groups saw an upwards trend over the 2 decades, while the growth rate varied in different groups. Population of S.E. Asian almost doubled, from 12% to 23% in 2008, just one percent lower than that of Polynesian, which rose from 18% in 1988. Indians remained the minority with only 8500 in 2008, making up 6% of total population. Overall, the population of Atlantis City increased steadily from 89000 to 110500 in 1998 and 152000 in 2008. Caucasians remained the major ethnic group but it proportion decreased, with corresponding increases of weight of other ethnic groups.
