- 分享到:
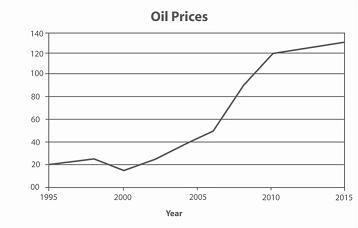
The graph contains information about the price in US dollars of a barrel of oil from 1995 with predictions to 2015.
Summarise the information by selecting and reporting the main features, and make comparisons where relevant.
Write at least 150 words.
作者学术词汇使用比较准确,不过文中词汇表达贫乏;简单的使用了一些复杂句,但从句使用不充分;过渡词和衔接词使用欠丰富,层次欠清晰;连词使用偏少;请提高文章内敛性,段落和句子要围绕主题展开。
The line chart illustrates that the price in US dollars of a barrel of oil since 1995 to 2015. It is clear that the oil prices slowly climb to 22 since 1995 to 1998.By 1998,the oil prices decreased since 22 to 18 and the oil prices revived.Nonetheless,the oil prices increase since 18 to 50 and continue sharply increase to 120 by 2010.It is obvious that the oil prices slowly grow to approximately 130 since 2010 to 2015. Overall,the oil prices is valley of 18 by 2000 and the peak of oil prices is 130 by 2015.
